
No matter what industry you’re in, it’s good to know the numbers that are leading and lagging indicators of how your business is performing.
The same is true in marketing: You should understand “the numbers” of your website. For most of our clients, those numbers come in the form of Google Analytics metrics. Let’s take a quick look at what they mean.
Understanding Your Google Analytics Metrics
Let’s Start at the Top
![]()
At the top of your Google Analytics report is the “Summary,” which shows the dates covered in the report. In most cases, we set the “comparison” numbers to the same month in the previous year, not the previous month. Year-over-year comparisons are useful because so many industries are seasonal.
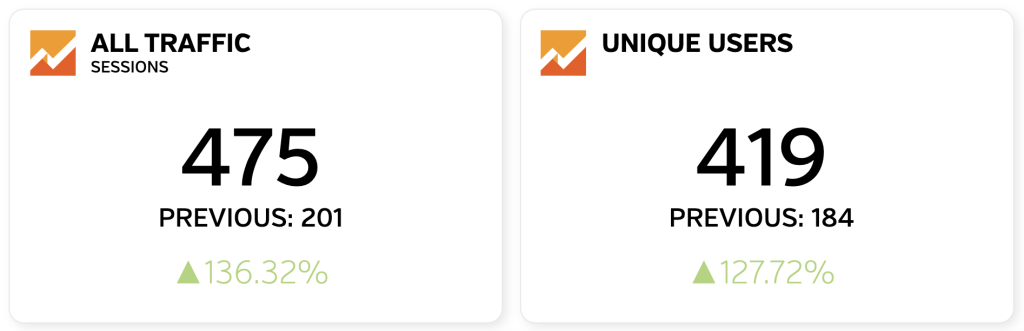
Next are raw numbers for “All Traffic” and “Unique Users”:
- All Traffic (sessions): This is the total number of browsing sessions in a month.
- Unique Users: This is the total number of users (people) who browsed your website in the month.
As you can see, there were more sessions than users, which indicates some users visited this website multiple times.
Where Traffic is Coming From

Your website’s traffic is broken down into 5 unique categories:
- Direct: Users who typed your website domain into a browser and went directly to it. These number can, at times, be skewed by spam/bot traffic.
- Organic Search: Users who used a search engine and clicked on an organic (non-paid) listing returned by the search engine.
- Referral: Users who clicked on a link to your website from another website that links to yours.
- Social: Users who clicked on a link in a social media post (yours or others) and landed on your website.
- Email: Users who clicked on a link to your website in an email you (or someone else) sent out to people.
Depending on your marketing efforts, you may see other categories here as well (paid search, display ads, etc.).
The columns show the data for the month and the difference between the comparative month (in this case, the same month of the previous year). Let’s take the “Direct” traffic and do a quick analysis of the numbers:
- Users: A bit self-explanatory, but these are wh
- Sessions: This is the same “sessions” described at the top of the page. In November 2020, there were 229 visits vs. 91 in 2019, an increase of 151.65%.
- Bounce Rate: The percentage of “single-page sessions” on your site. This means the visitor did not browse beyond the page they landed on. The lower the number, the better. Ideally, a visitor will look at more than one page and spend more time on your website, learning more about your business.
- Pages/Session: This is the number of pages a visitor views per session, on average.
- Avg. Session Duration: In other words, how long did the average user spend on your site? The longer the session duration, the better.
- Page Views: This is the raw number of page views; the percentage growth/decline over the comparison month and the actual number of page views for that month vs. the number of page views for the comparison month.
Referral Domains
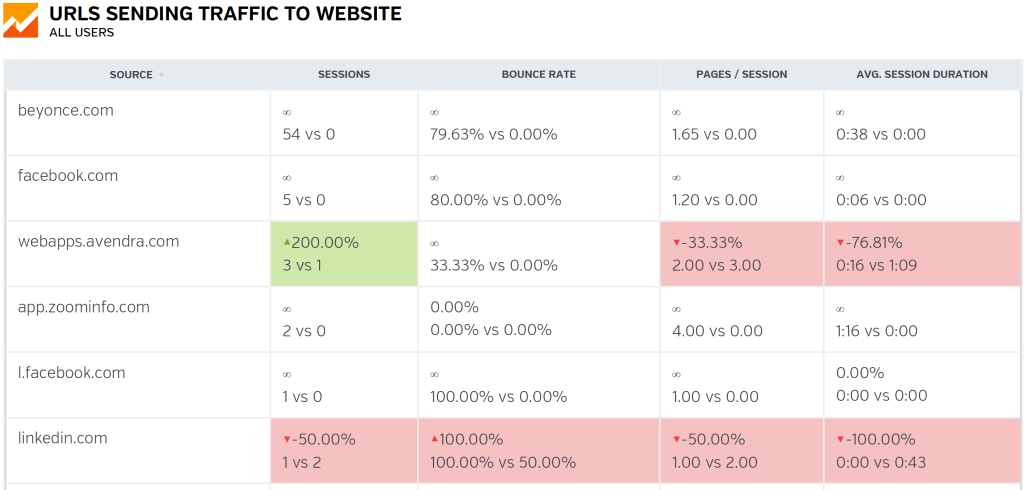
“URLs Sending Traffic to Website” is a breakdown of the data on visitors who arrived at your website from another website (not from a search engine). As in the examples above, the percentage is the increase or decrease over the comparison month for the traffic from the URL (domain) listed at the left. This data helps you understand what websites are sending you the most “referral traffic.”
Landing Pages
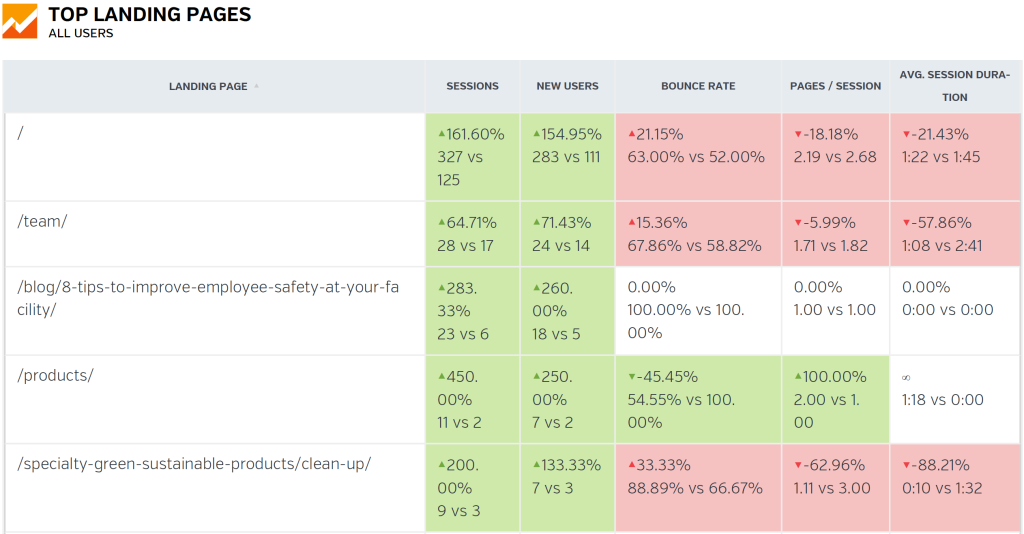
“Top Landing Pages” shows the pages on your site that were the most popular entry points for visitors. In this example the “/” indicates the home page is the most popular way for someone to enter this site, followed by /team/, then the blog post “8 Tips to Improve Employee Safety at Your Facility.”
Again, the numbers are the same concepts as those above. Added is the “new users” column, which gives you numbers for people who are visiting the website for the first time. In this example, the number of sessions (unique browsing sessions) and new users (first time to the website) consistently outpaced the same month of the previous year.
Let’s Get Social
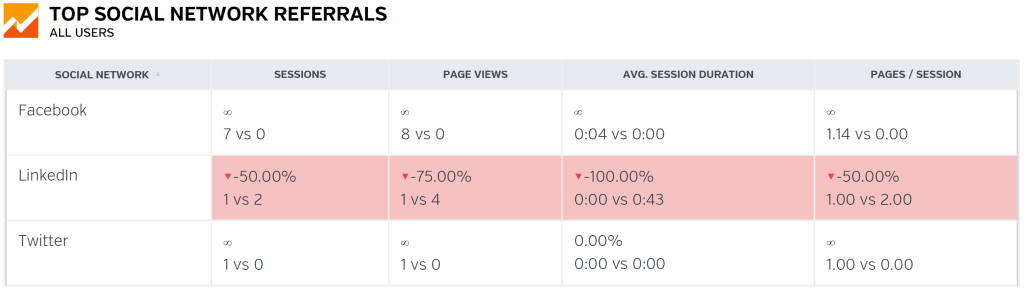
“Top Social Network Referrals” is the same data as the examples above, but filtered to only show traffic that came from the various social media platforms.
Hopefully this guide is a great start to helping you understand how people are interacting with your site. Have questions? Need more info? We’re just an email or phone call away!